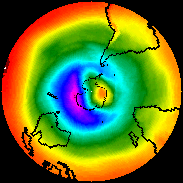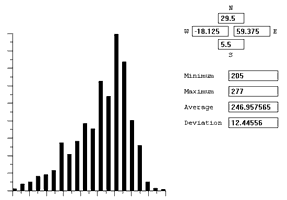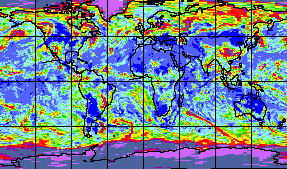

The three images above demonstrate some of the multiple projections Visuanalyze is capable of displaying. The ability to view multiple projections is especially important with ozone data because of the Antarctic ozone hole and the concern for corresponding ozone depletion in the Northern Hemisphere.
 |
This image is a full-size duplicate of the middle graphic shown above. Purple pixels above the Antarctic continent clearly show the ozone hole. It forms in the Antarctic spring (September - November) as chlorine is concentrated over the south pole. Using Visuanalyze, the full TOMS dataset, including ADEOS-TOMS and the currently operational TOMS EP, can be examined. |
The ability of VisuAnalyze to construct a histogram of the data is another
valuable tool. It can be applied to all the
data or a selected region. In addition to the histogram itself, minimum,
maximum, and average values are displayed, along with the
deviation. VisuAnalyze is also capable of displaying a graph of ozone values
along an arbitrary line.

TOMS data also includes a reflectivity channel, which needs to be displayed
with a different palette from the total ozone data.
The color mapping of palettes in VisuAnalyze can be optimized for each
individual day or set to specified endpoints for consistency
during a time series. The reflectivity image below shows continental outlines
and latitude/longitude lines, both of which can be
optionally applied by VisuAnalyze.

Both VisuAnalyze and VisuAnalyze Lite 2.0 are available from Research & Professional Services for PC and Macintosh. Inquiries for custom implementations and availability of the UNIX version are welcome.
email: visuanalyze@rpsc.com
Back to VisuAnalyze & VisuAnalyze Lite