Powerful, easy-to-use, standard software solutions for visualization & analysis of satellite data sets. For pricing and ordering information, contact us at: visuanalyze@rpsc.com
New: Animation is one of the upcoming features of VisuAnalyze.

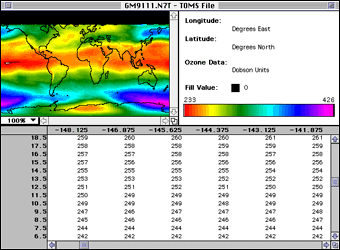
VisuAnalyze is capable of simultaneously displaying TOMS ozone data in tabular and graphical format. Metadata, continental outlines, and a scale relating color to value are also shown. This global Nimbus-7 TOMS image (slightly reduced) shows the relativly high ozone levels during the Antarctic Summer.
 Display and analysis of TOMS ozone data is the current strength of VisuAnalyze. Capabilities include
display of poth total ozone and reflectivity data, multiple projections & palettes, tabular format, histograms, and linear plots.
 Other data in HDF format can also be examined using VisuAnalyze.
Enhancements in future versions will include advanced funtions such as animation and mathematical analysis.
Comparison of Features
VisuAnalyze Lite 2.0:
VisuAnalyze adds to that:
METEOR 3 TOMS Ozone Data
Earth Probe TOMS Ozone Data
ADEOS TOMS Ozone Data
NIMBUS 7 TOMS Reflectivity Data
METEOR 3 TOMS Reflectivity Data
Earth Probe TOMS Reflectivity Data
ADEOS TOMS Reflectivity Data
NIMBUS 7 UV Data
Zoom In/Out
Print
More Palettes
More Grid & Overlay Choices
More Sophisticated Selections
More Projections
Both VisuAnalyze and VisuAnalyze Lite 2.0 are available from Research & Professional Services for PC and Macintosh. Inquiries for custom implementations and availability of the UNIX version are welcome.
email: visuanalyze@rpsc.com
Back to www.rpsc.com (or just click on our logo)